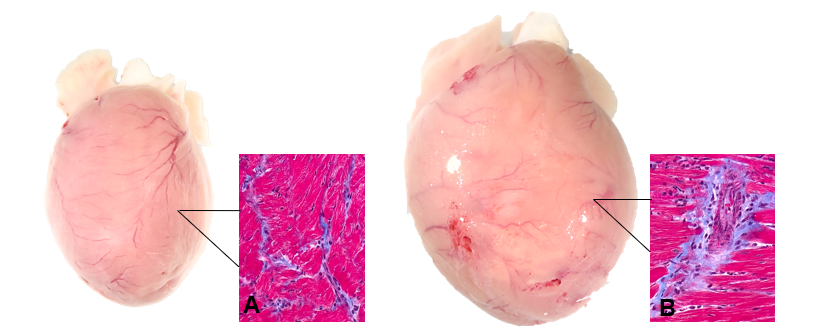
Diabetic cardiomyopathy is generally characterized by adverse cardiac remodeling, a complication from poorly regulated diabetes. Frequently, there are findings of hypertrophy, fibrosis, and reduced diastolic function.
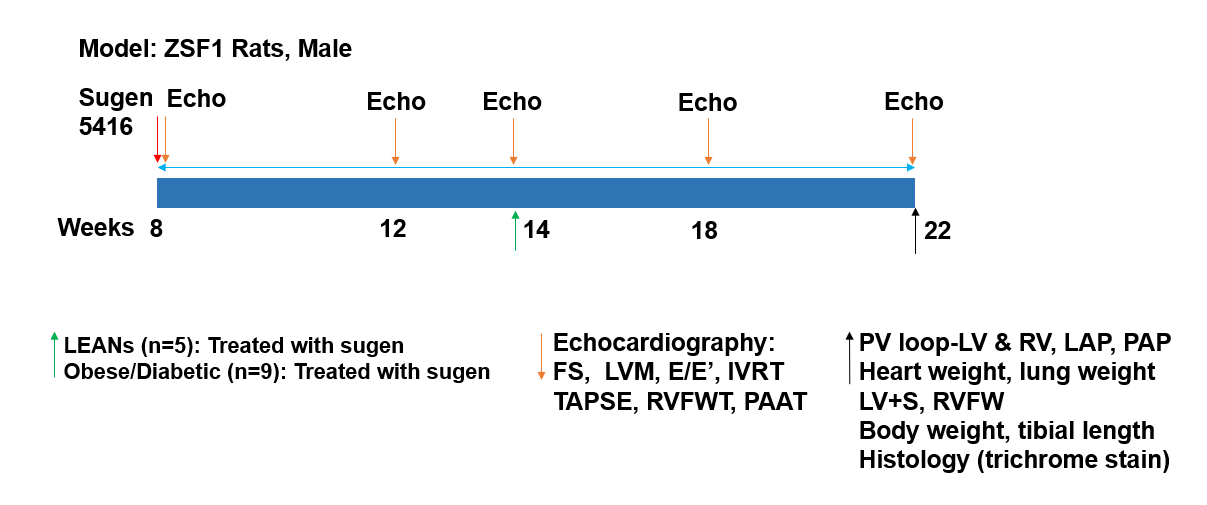
Experimental Protocol
ZSF1 Rats treated with sugen are monitored for cardiac remodeling at specific timepoints during the study. A non-invasive echocardiogram is performed at 8 (baseline), 14, and 22 (final) weeks. A live pressure- volume loop is obtained at 22 weeks followed by final measurements, sample collection, and histology.
Histology
Figure 1. Cardiac hypertrophy and left-ventricular fibrosis in the (A) Lean and (B) Diabetic rats.
Table 1. Echocardiogram parameters at 8 weeks, 14 weeks, and 22 weeks in lean and diabetic rats.
Abbreviations: IVSd, Interventricular Septum Thickness at end Diastole; LVEDd, Left-Ventricular End-Diastolic Dimension; LVPTd, Left-Ventricle Posterior Wall Thickness Diastole; IVSs, Interventricular Septum Thickness at end Systole; LVESd, Left-Ventricular End-Systolic Dimension; LVPTs, Left-Ventricle Posterior Wall Thickness Systole; HR, Heart Rate; FS, Fractional Shortening; EF, Ejection Fraction; LVM, Left Ventricular Mass; E/E’, Left Ventricular Diastolic Function; RVFWT, Right Ventricle Free Wall Thickness; TAPSE, Tricuspid Annular Plane Systolic Excursion; PAAT, Pulmonary Artery Acceleration Time; RVFAC, Right Ventricle Fractional Area Changes. All parameters are expressed as means ± the SD. The P value was calculated by comparing the final echo between the Lean and Diabetic rats.
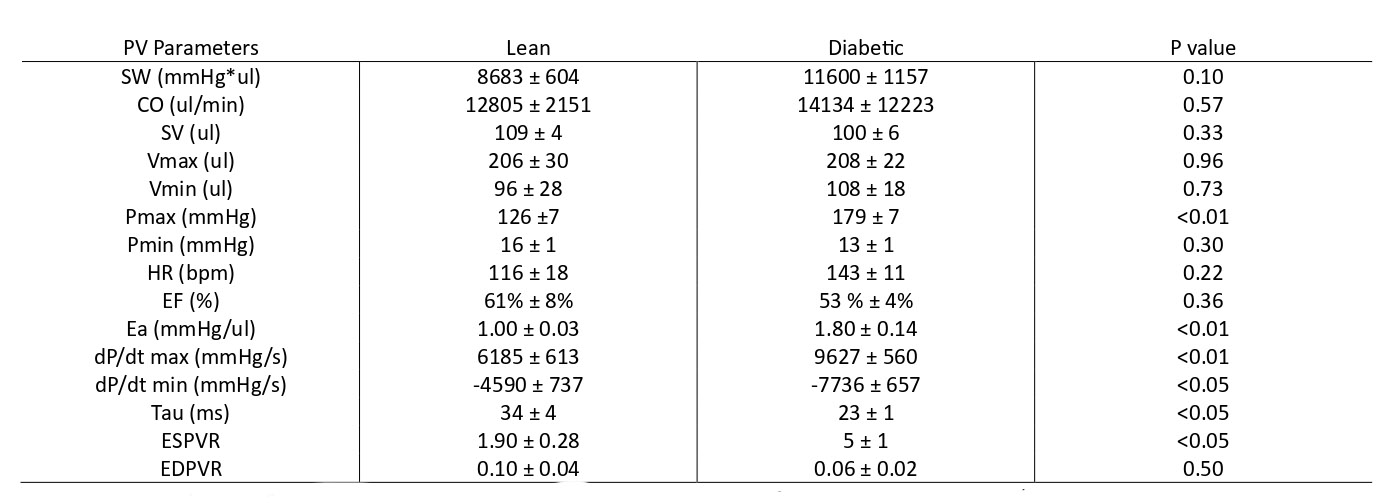
Table 2. Pressure-volume parameters of the left ventricle (open chest) in lean and diabetic rats.
Abbreviations: SW, Stroke Work; CO, Cardiac Output; SV, Stroke Volume; Vmax, Maximum Volume; Vmin, Minimum Volume; Pmax, Maximum Pressure; Pmin, Minimum Pressure; HR, Heart Rate; EF, Ejection Fraction; Ea, Arterial Elastance; dP/dt max, maximum derivative of change in systolic pressure over time; dP/dt min, minimum derivative of change in diastolic pressure over time; Tau, Left Ventricle Relaxation Constant; ESPVR, End-Systolic Pressure-Volume Relationship; EDPVR, End-Diastolic Pressure-Volume Relationship.