Diabetic cardiomyopathy is generally characterized by adverse cardiac remodeling, a complication from poorly regulated diabetes. Frequently, there are findings of hypertrophy, fibrosis, and reduced diastolic function. This model can be represented in db/db mice.
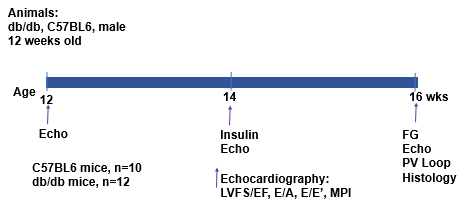
Experimental Protocol
The db/db mice are monitored for cardiac remodeling at specific timepoints during the study. A non-invasive echocardiogram is performed at ages 12, 14, and 16 weeks. Insulin is tested at 14 weeks. Fasting glucose is tested at 16 weeks. A live pressure-volume loop is obtained at 16 weeks followed by final tests, measurements, sample collections, and histology.
Histology
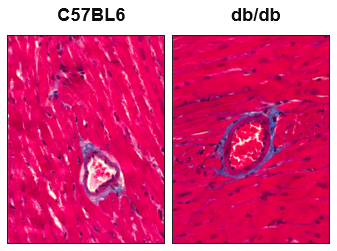
Figure 1. Masson’s trichrome staining of left ventricle in C57BL6 and db/db mice. Blue staining indicates fibrosis, as seen increased around a blood vessel in the db/db mice
Echocardiography
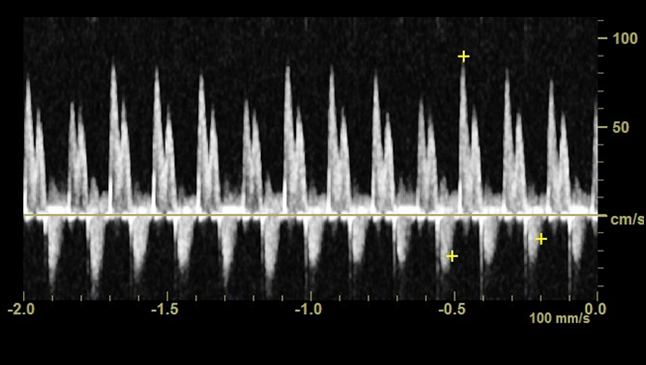
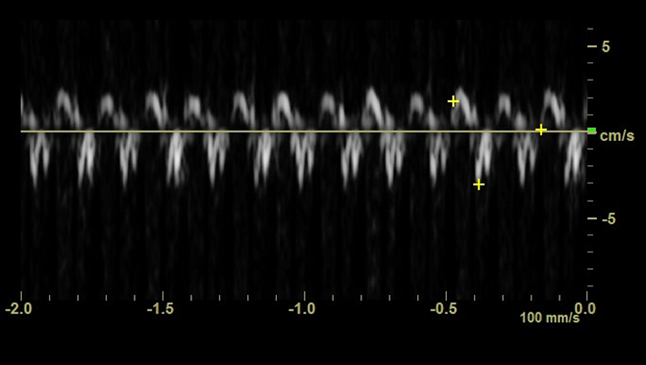
Figure 2. Pulsed-wave Doppler (PWD) recording of left ventricular mitral inflow in a C57BL6 mouse showing a normal E/A ratio.
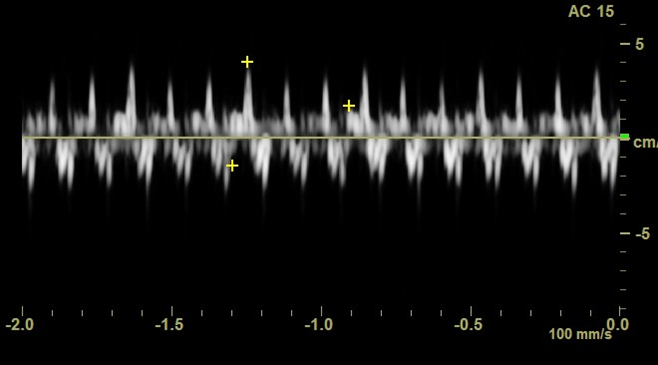
Figure 3. Pulsed-wave Doppler (PWD) recording of left ventricular mitral inflow in a db/db mouse showing an elevated E/A ratio indicating diastolic dysfunction.
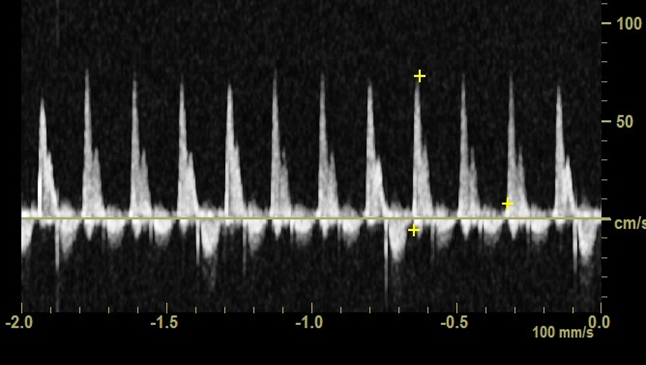
Figure 4. Tissue Dopler (TDI) recording at the septal side of the mitral valve annulus in a C57BL6 mouse showing normal E’.
Figure 5. Tissue Dopler (TDI) recording at the septal side of the mitral valve annulus in a db/db mouse showing inverted E’/A’ with a reduced E’ contributing to an elevated E/E’. This is indicative of diastolic dysfunction.
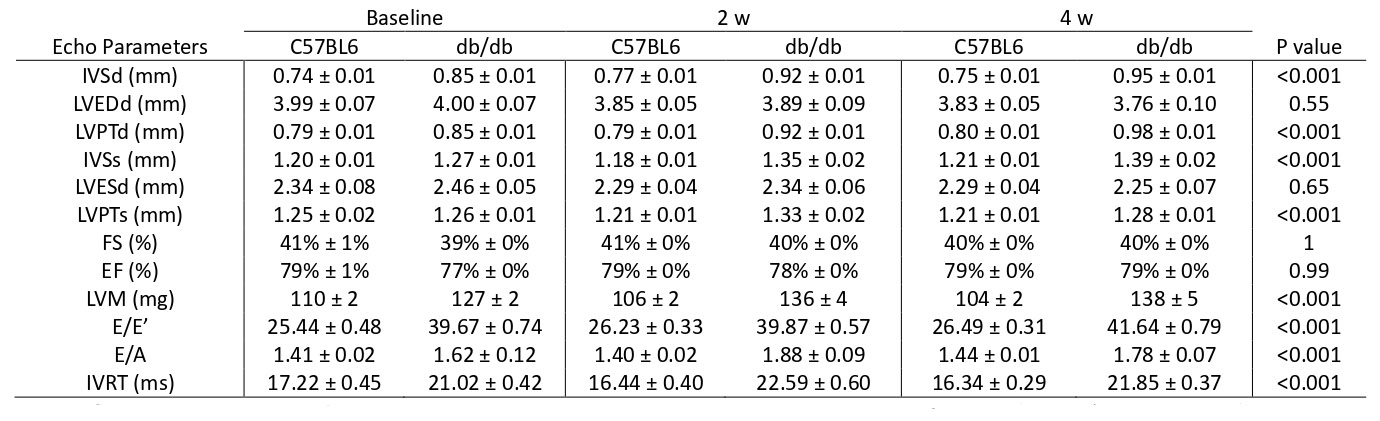
Table 1. Echocardiogram parameters at baseline, 2 weeks, and 4 weeks in C57BL6 and db/db mice.
Abbreviations: IVSd, Interventricular Septum Thickness at end Diastole; LVEDd, Left-Ventricular End-Diastolic Dimension; LVPTd, Left-Ventricle Posterior Wall Thickness Diastole; IVSs, Interventricular Septum Thickness at end Systole; LVESd, Left-Ventricular End-Systolic Dimension; LVPTs, Left-Ventricle Posterior Wall Thickness Systole; FS, Fractional Shortening; EF, Ejection Fraction; LVM, Left Ventricular Mass; E/E’, Left Ventricular Diastolic Function; E/A, Left Ventricular Diastolic Function; IVRT, Isovolumetric Relaxation Time. All parameters are expressed as means ± the SEM. The P value was calculated by comparing the final echo between the C57BL6 and db/db mice.
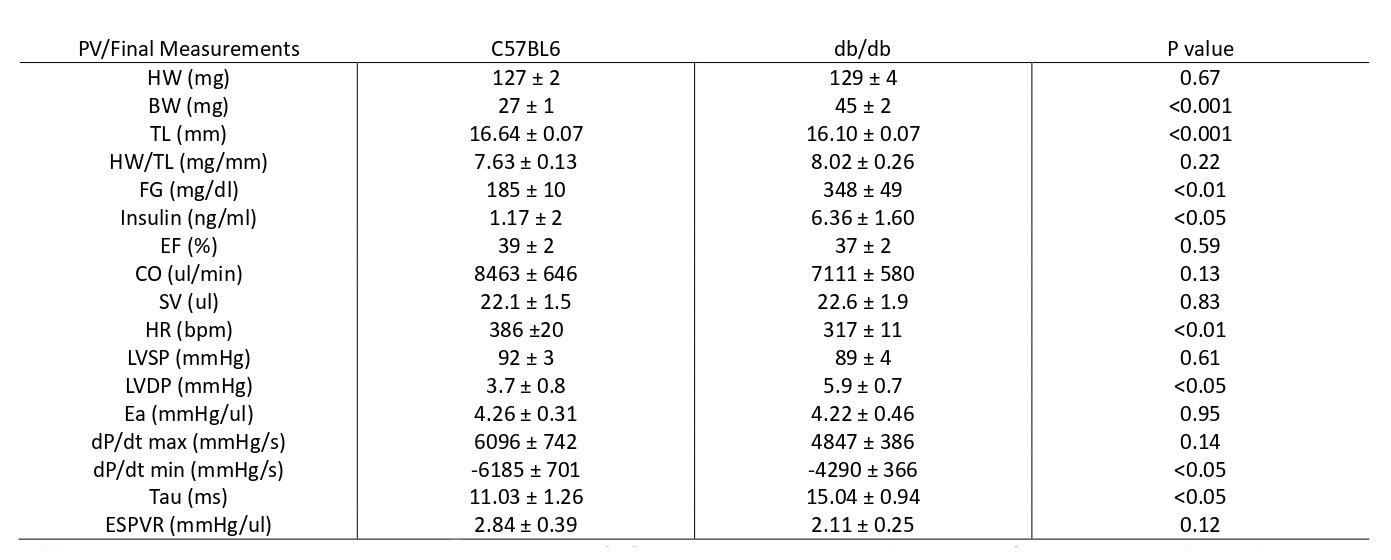
Table 2. Pressure volume parameters and end measurements in C57BL6 and db/db mice.
Abbreviations: HW, Heart Weight; BW, Body Weight; TL, Tibia Length; FG, Fasting Glucose; EF, Ejection Fraction; CO, Cardiac Output; SV, Stroke Volume; HR, Heart Rate; LVSP, Left Ventricle Systolic Pressure; LVDP, Left Ventricle Diastolic Pressure; Ea, Arterial Elastance; dP/dt max, maximum derivative of change in systolic pressure over time; dP/dt min, minimum derivative of change in diastolic pressure over time; Tau, Left Ventricle Relaxation Constant; ESPVR, End-Systolic Pressure-Volume Relationship.