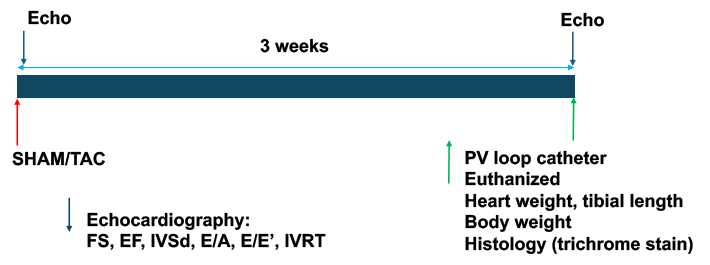
Mice were subjected to TAC or SHAM surgeries, and next day echocardiography was performed on all the mice. At the end of the experiment, echocardiography was repeated. Then a pressure-volume catheter was inserted into the left ventricle to measure cardiac hemodynamic.
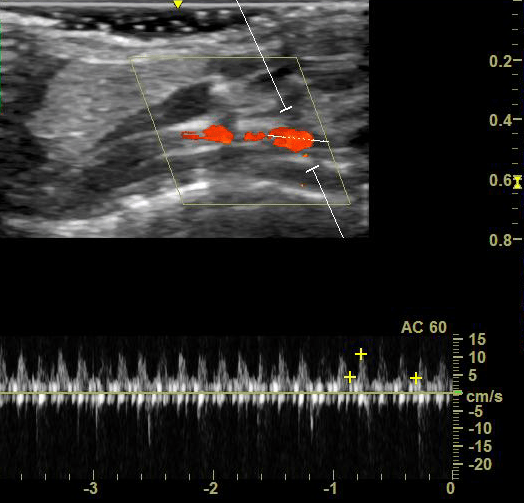
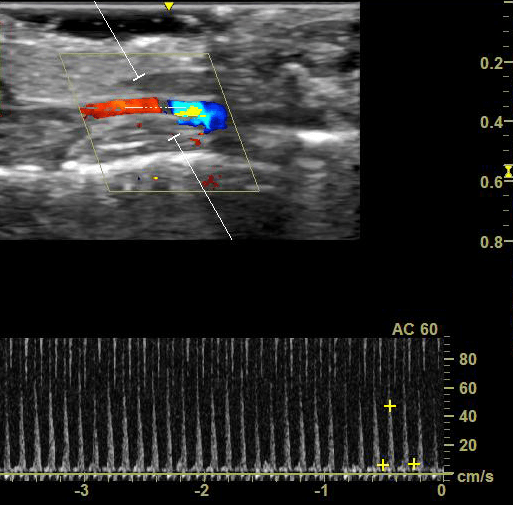
Decreased Flow Rate of Left Carotid Artery
Echo Doppler was used to measure the flow rates of the left (left) and right (right) carotid arteries.
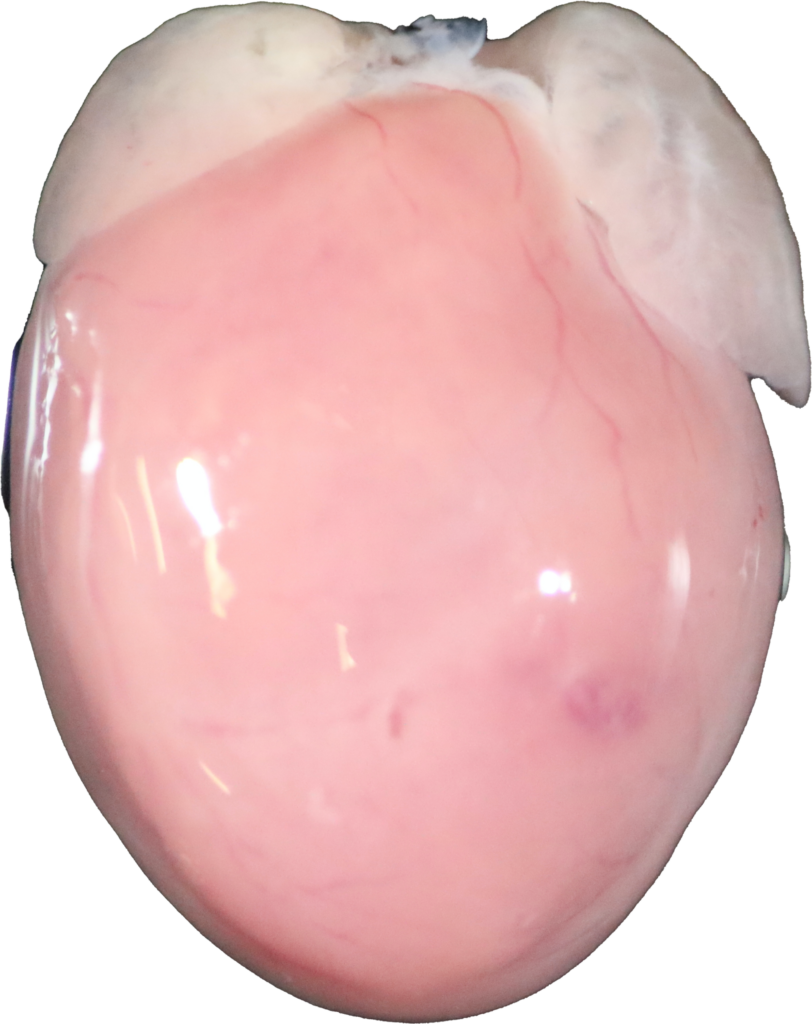
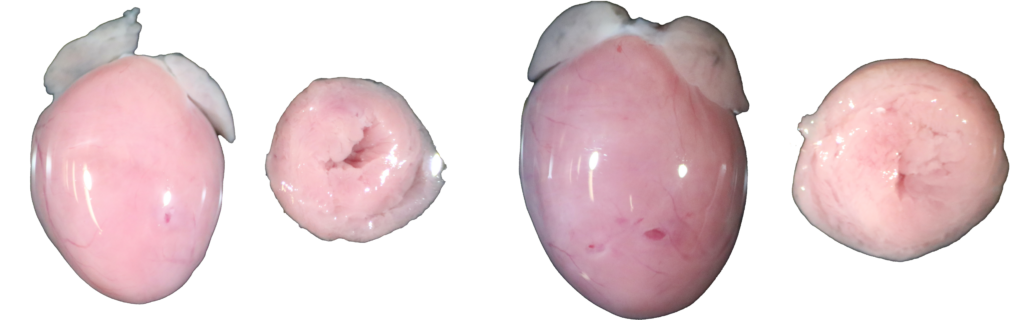
TAC-Induced Cardiac Hypertrophy
Sham (left) and TAC (right) hearts were examined after three weeks of surgery
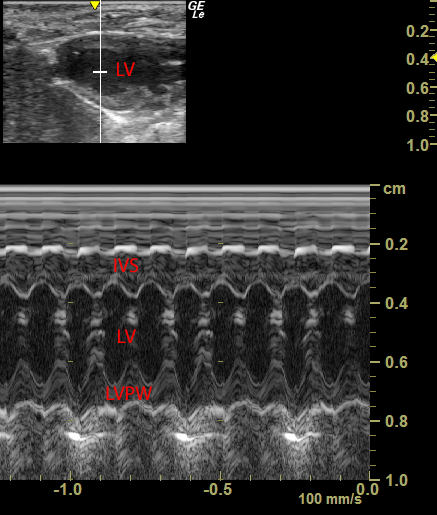
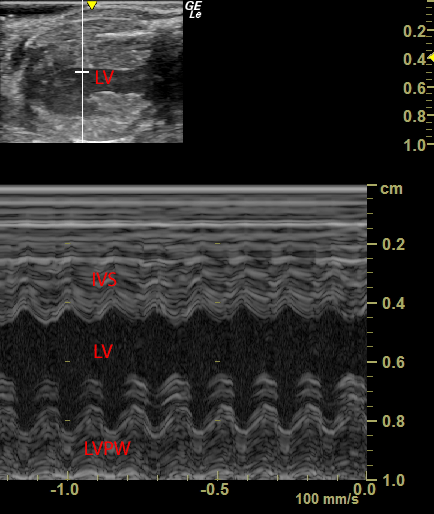
Echocardiography
Images were acquired from short-axis view on Sham (left) and TAC (right) mice after three weeks of surgery.
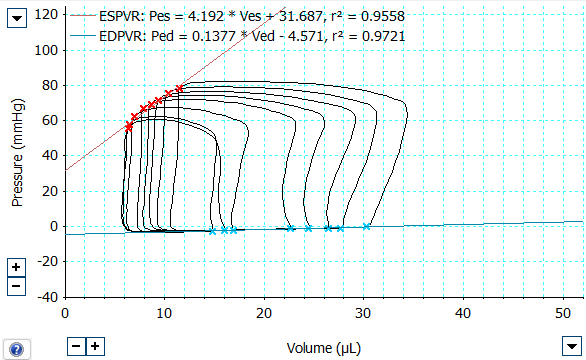
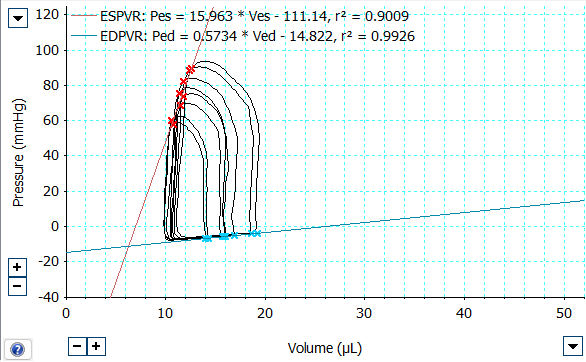
PV Loop Catheter
Left ventricular pressure and volume were recorded via a PV catheter in Sham (left) and TAC (right) mice after three weeks of surgery.
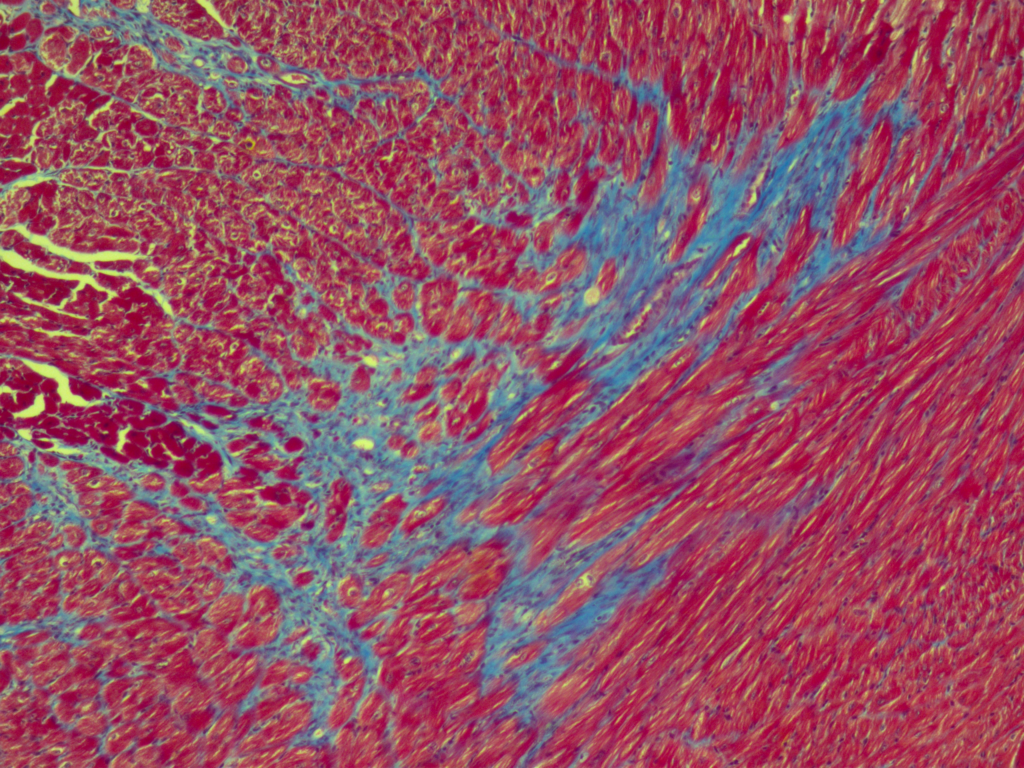
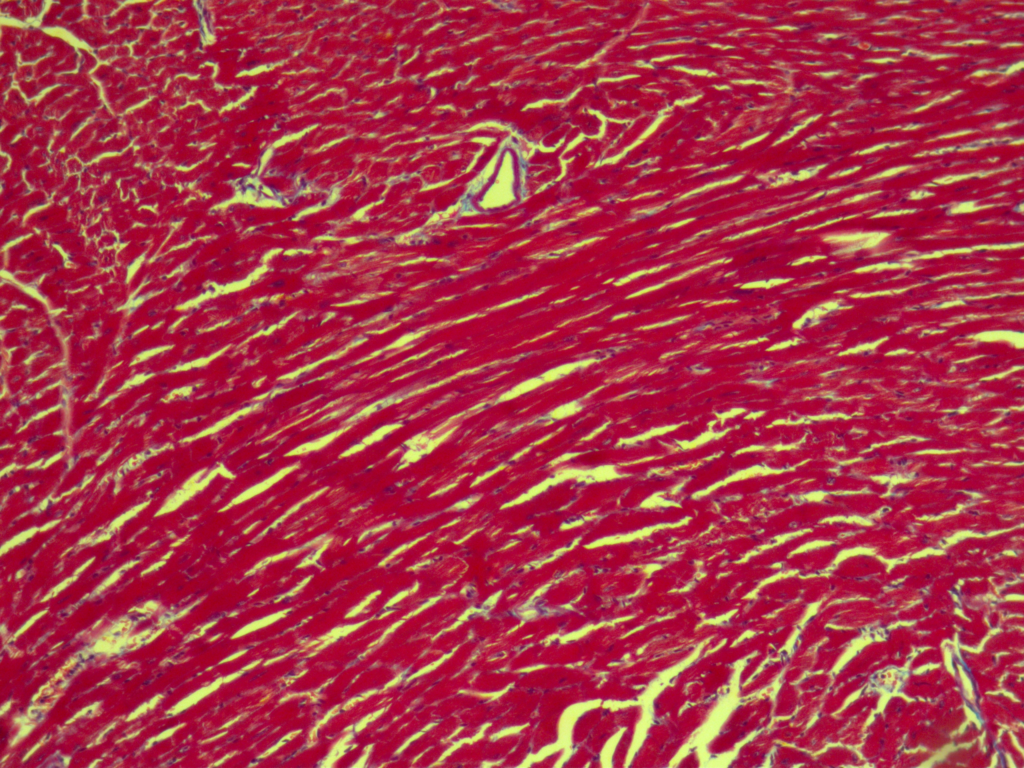
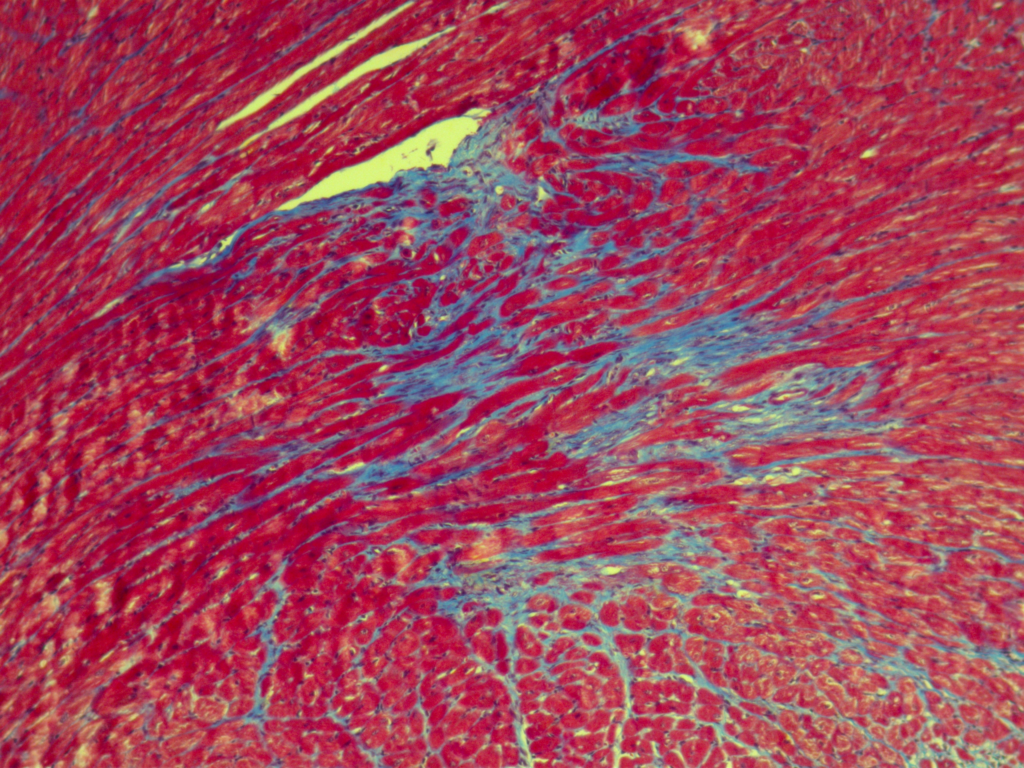
Masson's Trichrome Staining
Cardiac sections were stained by Masson’s trichrome in Sham (left) and TAC (right) mice after three weeks of surgery.