Myocardial Ischemia-Reperfusion Injury (IRI)
IRI results from blood flow through the ischemic area, also known as reperfusion injury. IRI is a common complication after ischemic organs are rescued from prolonged ischemia such as a heart attack or stroke. The Myocardial IRI model was the first model we developed in 2006 and remains a popular animal model for drug development.
Myocardial IRI mimics the cardiac injury that can occur after bypass surgery or angioplasty following a myocardial infarction. The IRI animal model is induced by occluding the left coronary artery for a prolonged time period. The occlusion is then reopened to allow for reperfusion of the blood. Cardiac function can be reduced after Ischemia-Reperfusion Injury (IRI); however, myocardial injury can be attenuated by an effective treatment.
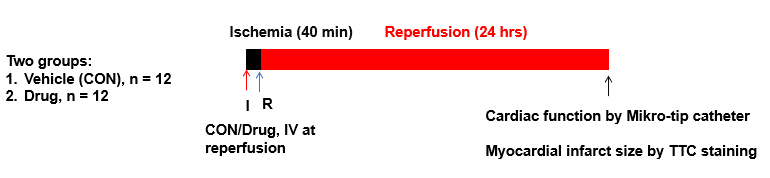
Experimental Protocol
![](https://cardio-lab.com/wp-content/uploads/2023/08/Myocardial-Ischemia-Reperfusion-exp.png)
![](https://cardio-lab.com/wp-content/uploads/2023/08/con-img.png)
Figure 1. 
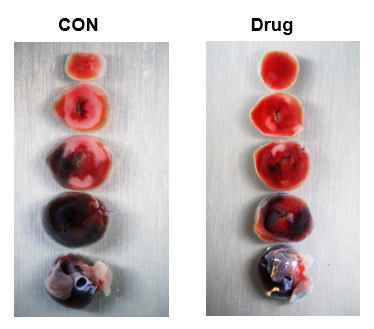
Mice were subjected to 40-min ischemia and 24 hrs of reperfusion. Hearts were isolated and sectioned into five pieces. TTC stained live tissue red. Infarcted tissue remained white. Non-ischemic tissue was stained by Evans blue.
Sample Data
![](https://cardio-lab.com/wp-content/uploads/2023/08/A-1.png)
![](https://cardio-lab.com/wp-content/uploads/2023/08/B-2.png)
Figure 2. (A) Myocardial infarct size (IS/LV or IS/AAR) was decreased in mice after IR by Drug. *: p<0.01, Drug vs. CON; #: p<0.01, Drug vs. CON; $: p>0.05, Drug vs. CON. (B) Cardiac contractility was improved in mice after IR by Drug. *: p<0.05, Drug vs. CON; #: p<0.05, Drug vs. CON.
![](https://cardio-lab.com/wp-content/uploads/2023/08/IS-LV-title-center-1.webp)
Figure 2. (A) Myocardial infarct size (IS/LV or IS/AAR) was decreased in mice after IR by Drug. *: p<0.01, Drug vs. CON; #: p<0.01, Drug vs. CON; $: p>0.05, Drug vs. CON. (B) Cardiac contractility was improved in mice after IR by Drug. *: p<0.05, Drug vs. CON; #: p<0.05, Drug vs. CON.
![](https://cardio-lab.com/wp-content/uploads/2023/08/troponin1-title-centered.webp)
Figure 4: Plasma Troponin I levels in the CON and TA mice, *: p<0.05, TA vs. CON.
![](https://cardio-lab.com/wp-content/uploads/2023/08/ISAAR-1.webp)
Figure 3. (A) Infarct size in the area at risk, *: p<0.001, TA vs. CON. (B) Area at risk in the left ventricle.
![](https://cardio-lab.com/wp-content/uploads/2023/08/AARLV-myocardial-IRI.webp)