Echocardiography is a non-invasive imaging tool that allows us to monitor cardiac remodeling in real time.
Transthoracic echocardiography is utilized to monitor and determine cardiac function and left ventricular morphology for cardiac disease models. Using a NextGen LOGIQe ultrasound machine, we have the capability to analyze left ventricular systolic, diastolic, regional and vascular function. The use of echocardiograms is a helpful non-invasive way to visualize and monitor progression of heart failure and cardiac remodeling. Combined with pulse wave Doppler (PWD) and tissue Doppler imaging (TDI), transthoracic echocardiography can be used to effectively quantify systolic and diastolic performance. This technique provides an alternative to terminal procedures to assess LV function, such as intracardiac pressure-volume loop measurements.
Systolic Function is analyzed using two-dimensional imaging (2D) (B-Mode). Standard measurements are taken including interventricular septum thickness at end diastole (IVSd), interventricular septum thickness at end systole (IVSs), posterior wall thickness diastole (PWTd), posterior wall thickness systole (PWTs), Fractional Shortening (FS), Ejection Fraction (EF), and Left Ventricular Mass (LVM).Diastolic Function is analyzed using pulse wave Doppler (PWD) and tissue Doppler imaging (TDI). The mitral valve E/E’ and E/A ratio and isovolumic relaxation time (IVRT) are taken to evaluate diastolic dysfunction.
Global Function is assessed using comprehensive measurements including Myocardial Performance Index and Cardiac Output.
Right ventricle free wall thickness (RVFWT), Pulmonary artery acceleration time (PAAT), Tricuspid annular plane systolic excursion (TAPSE), and Right ventricular fractional area change (RVFAC) measurements allow us to gain a complete picture of right ventricle function in models of right heart failure, chronic pressure overload, heart failure with preserved ejection fraction (HFpEF), and pulmonary hypertension.
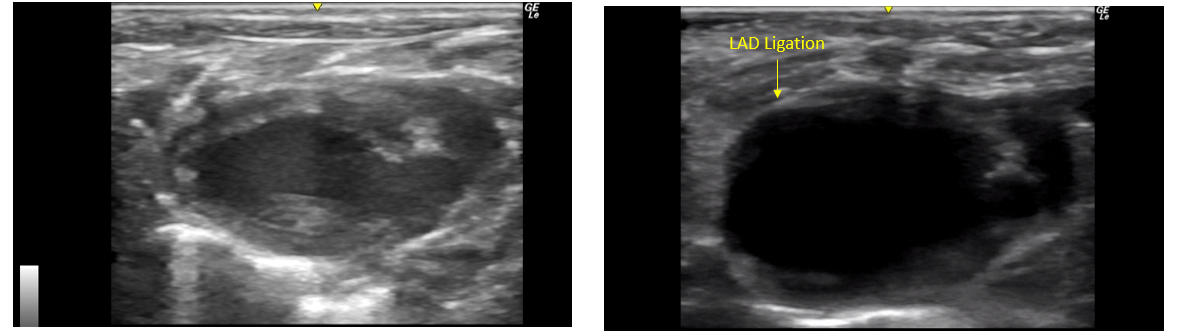
Parasternal Long-Axis (PLAX) View
Figure 1. The left picture shows a PLAX view of the SHAM mouse. The right picture shows a PLAX view of a mouse that underwent myocardial infarction (MI) surgery.
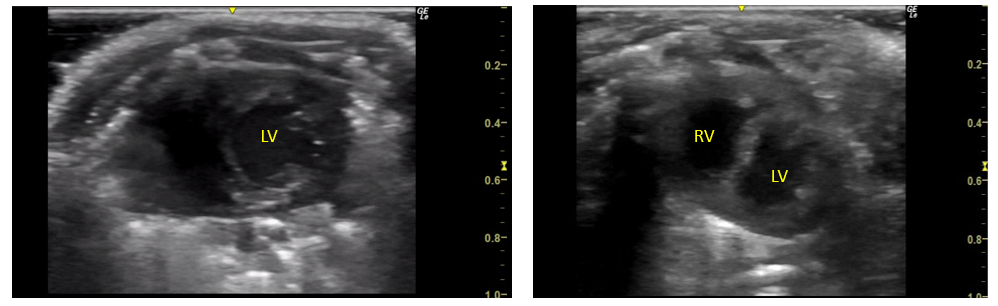
Parasternal Short-Axis (PSAX) View
Figure 2. The left picture shows a PSAX view of the SHAM mouse. The right picture shows a PSAX view of a mouse that underwent pulmonary artery banding (PAB) surgery where right ventricle hypertrophy is displayed.
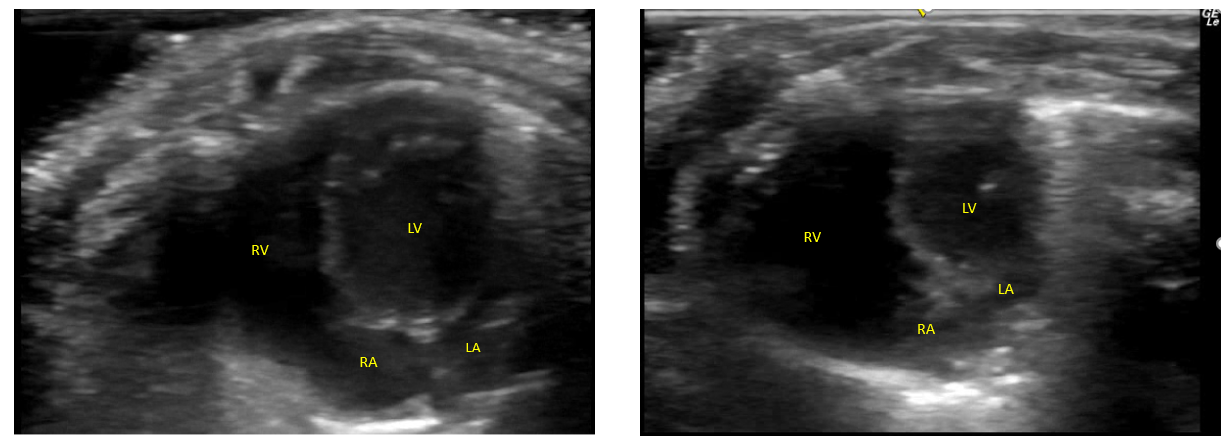
Apical Four Chamber View
Figure 3. The left picture shows an apical four chamber view of the SHAM mouse. The right picture shows an apical four chamber view of a mouse that underwent PAB surgery.
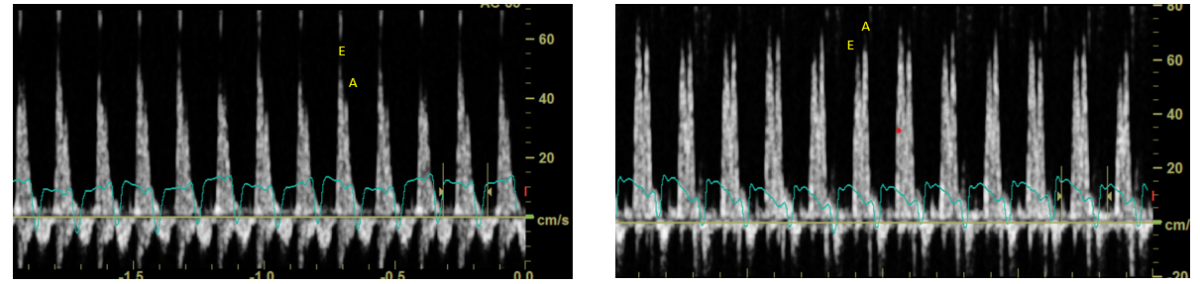
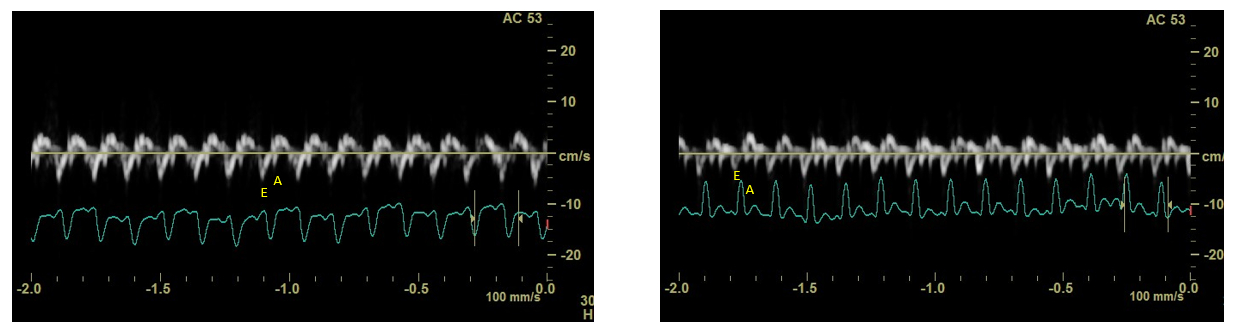
Pulsed Wave Doppler (PWD)
Figure 4. The left picture shows a PWD view of a SHAM rat. The right picture shows a PWD view of a HFpEF rat.
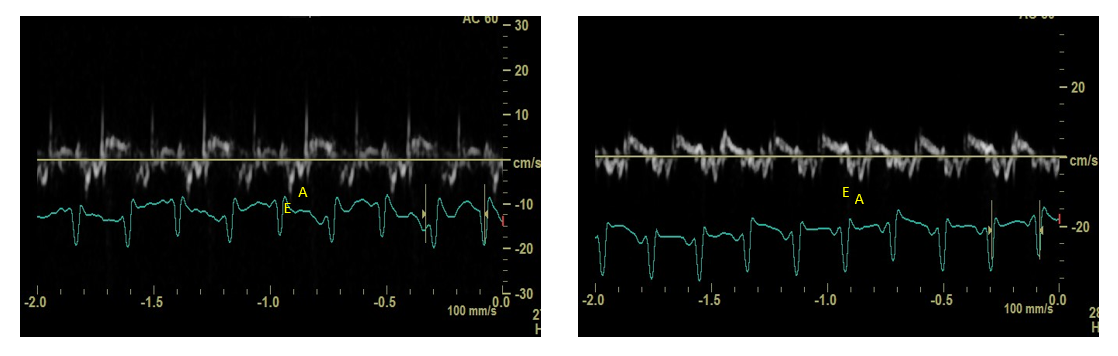
Tissue Doppler
Figure 5. The left picture shows a tissue Doppler view of a SHAM mouse. The right picture shows a tissue Doppler view of a HFpEF mouse.
Figure 6. The left picture shows a tissue Doppler view of a lean ZSF1 rat. The right picture shows a tissue Doppler view of a diabetic ZSF1 rat.
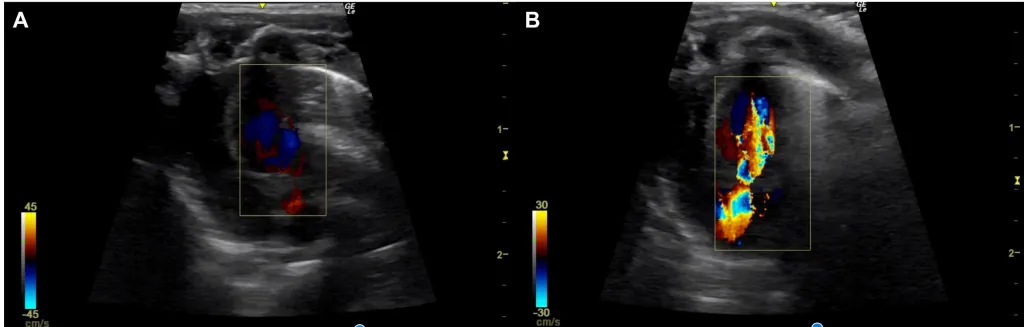
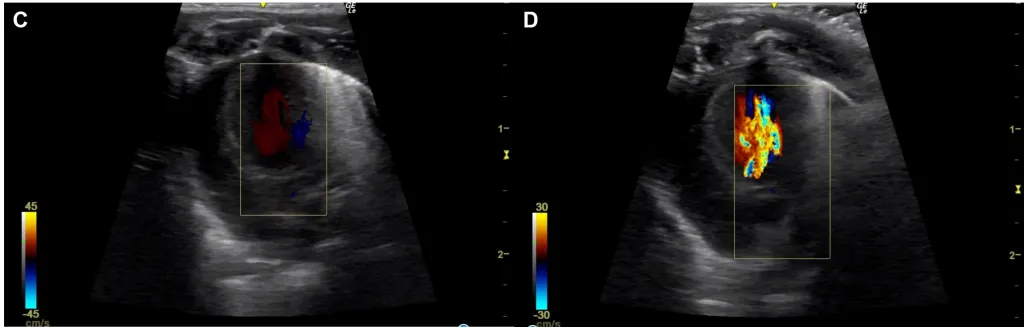
Color Doppler
Figure 7. Representative echocardiogram comparing the left ventricular blood flow of sham-operated control (SHAM) versus left atrial stenosis (LAS) rats. (A) Color Doppler echo of a SHAM rat when the heart is in systole versus (B) an LAS rat model showing mitral valve regurgitation when the heart is in systole. (C) Color Doppler echo of a SHAM rat when the heart is in diastole versus(D) an LAS rat model showing turbulent flow in the left ventricle when the heart is in diastole.